
Planning & Development
Demographic Data
The City of Houston’s Population is 2,328,285*
The land of area of Houston is 671.745 square miles
The Planning and Development Department uses information from the U.S. Census Bureau along with other agencies to develop demographic data and estimates for the City as well as City Council Districts and City Super Neighborhoods. Demographic data includes, but is not limited to: population, housing, household, income and other social characteristics. Please see official demographic descriptions for further details. For more information, please contact Larry Nierth at Larry.Nierth@houstontx.gov.
*Source: City’s Estimate using U.S. Census Bureau Housing Unit Methodology, July 1, 2023
Letter from U.S. Census Bureau - Revised July 1, 2022 Census Population and Housing Count
How We Compare
![]() View the graphs, and charts that analyze how Houston compares with the largest cities
in Texas and the U.S. in terms of Demographics, Social, Economic and Housing
characteristics.
View the graphs, and charts that analyze how Houston compares with the largest cities
in Texas and the U.S. in terms of Demographics, Social, Economic and Housing
characteristics.
Demographic Information
Note: All data are in .pdf or .xls or .xlsx format, unless otherwise indicated.
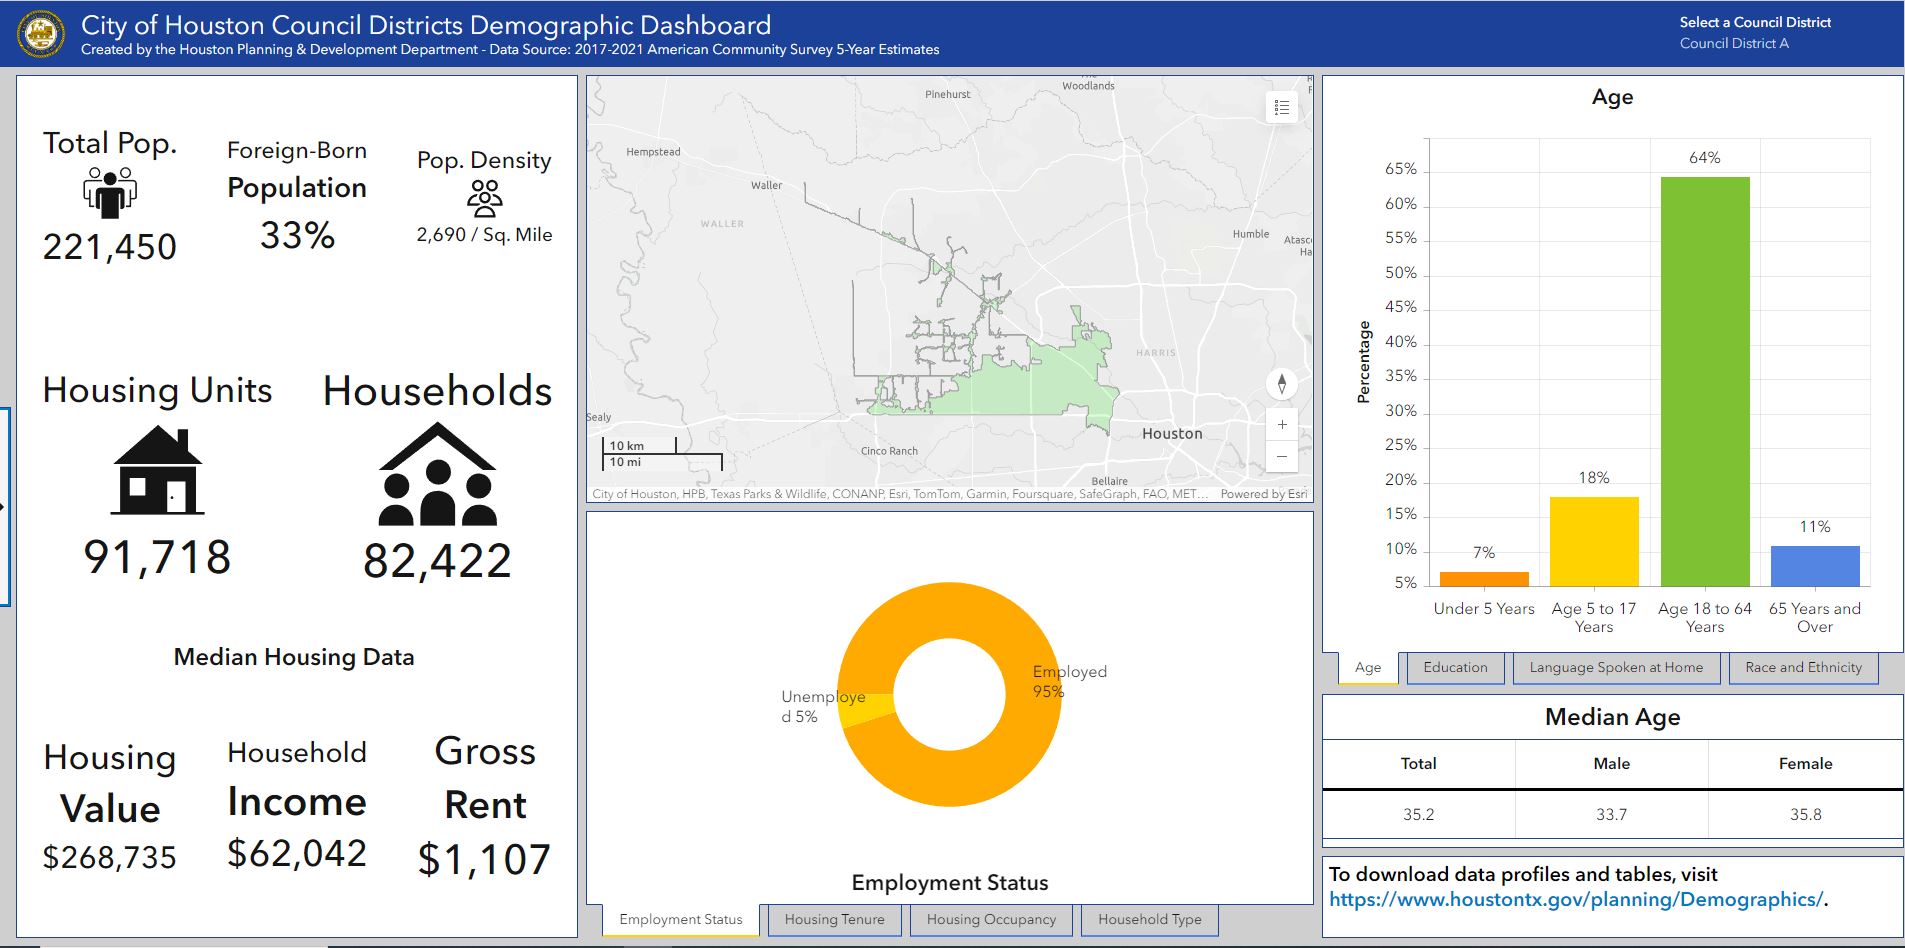
Online Demographic Dashboards Available for Council Districts and Super Neighborhoods!
Reccomended devices to view:
*Laptop/Desktop
Or
Mobile Phone
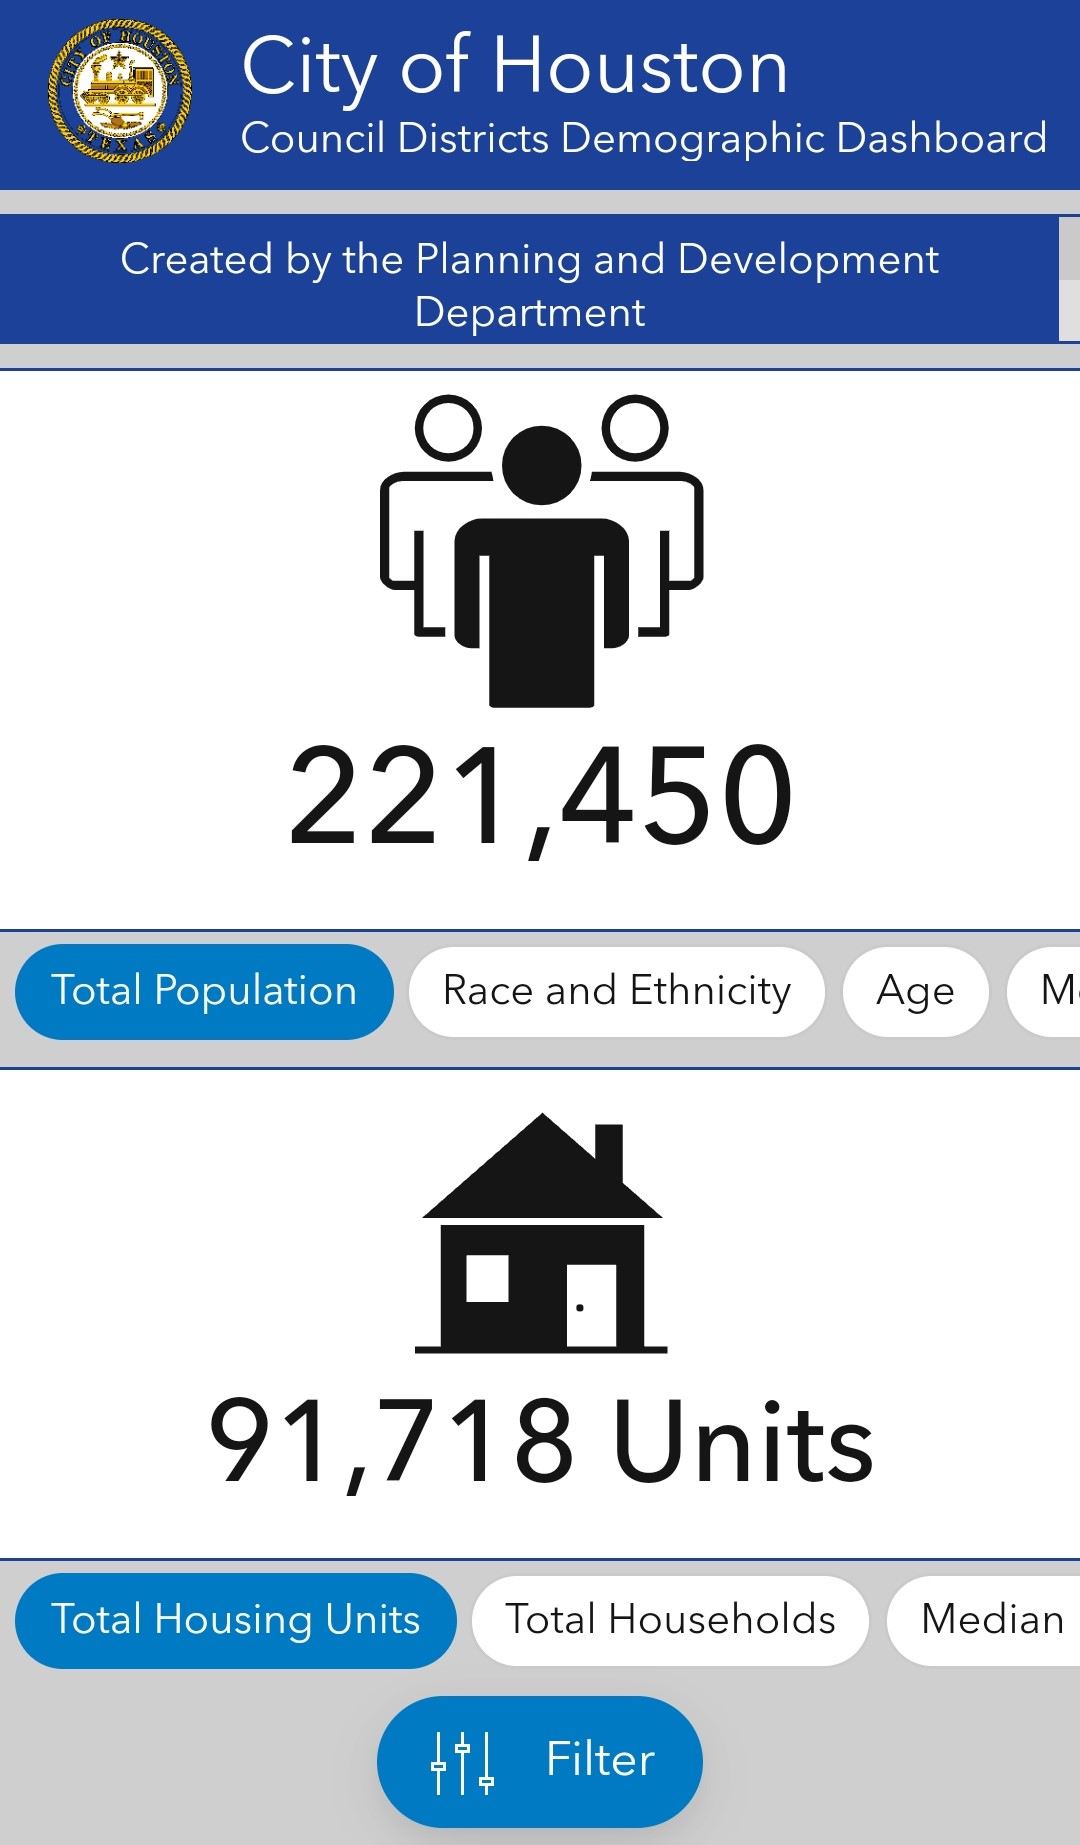
- Click here to view Council Districts Demographic Dashboard
- Click here to view Super Neighborhoods Demographic Dashboard
*Please check your current monitor or screen display settings to make sure your screen is scaled at 100 percent.
-
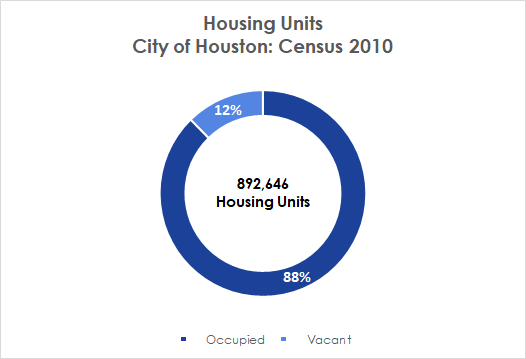
Click the image to enlarge
-
Click the image to enlarge
-
Click the image to enlarge
-
Click the image to enlarge
-
Click the image to enlarge
-
Click the image to enlarge
-
Click the image to enlarge
Census 2020 Data
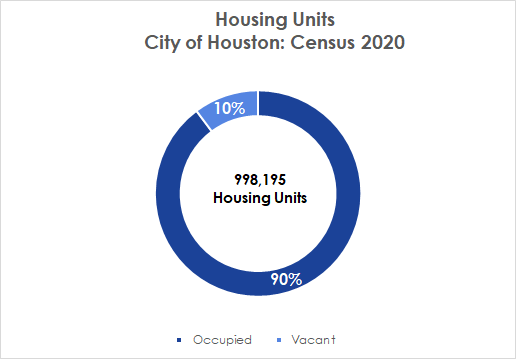
2020 City of Houston Detailed Demographics and Housing Characteristics
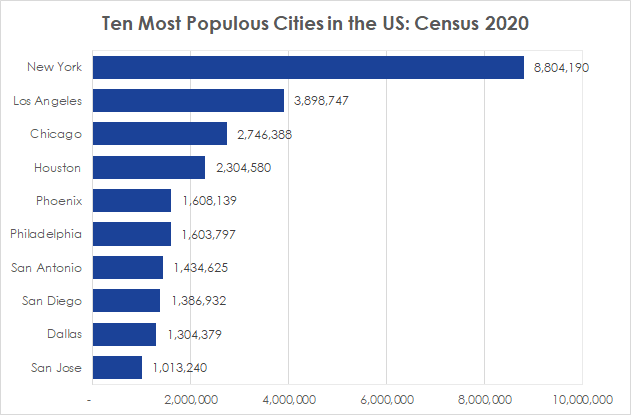
Population Trend: Major Cities & Metros:
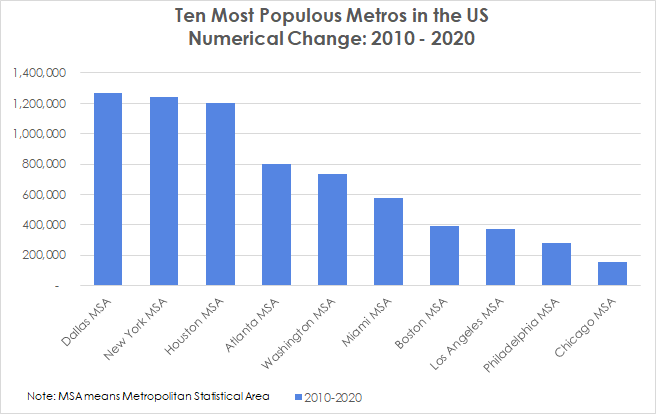
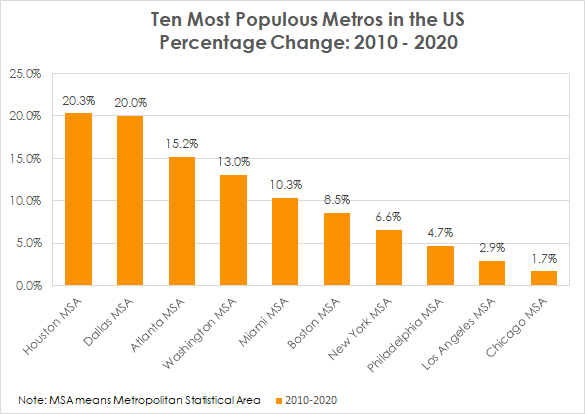
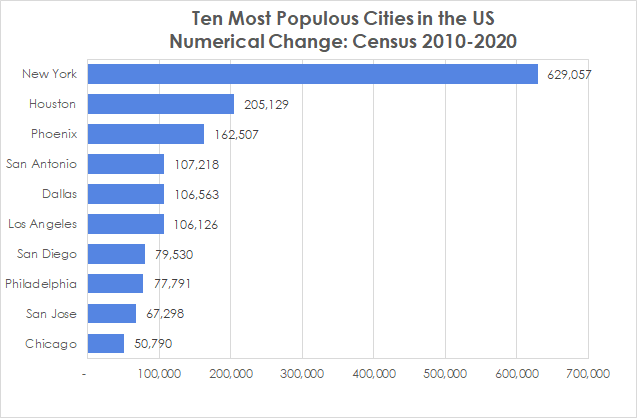
- Ten Most Populous Cities in the US 2000 - 2020
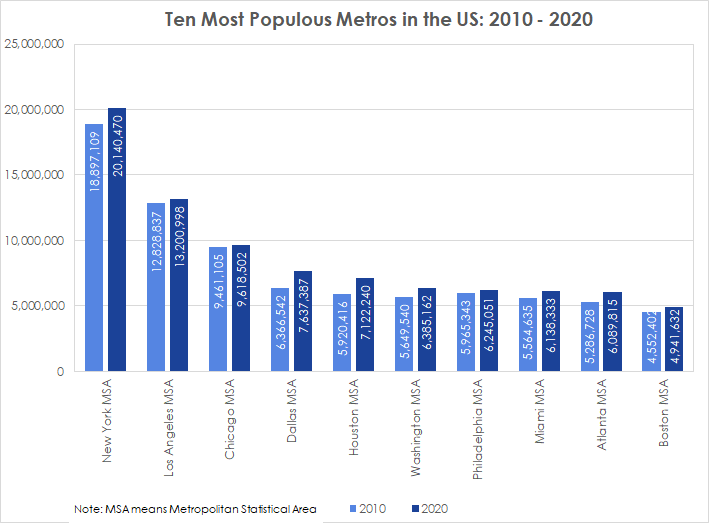
- Ten Most Populous Metros in the US 2010 - 2020
- Ten Most Populous Cities in Texas 2010 - 2020
2020 City of Houston Population and Housing Trend:
2020 City of Houston Data by Blocks:
Demographic Quick Facts:
City/County/METRO Race and Ethnicity 2022 Landscape
City County Metro Race Ethnicity ACS 2022 Landscape
2022 Demographic Narrative ProfilesAmerican Community Survey 2022 5-year estimates, Released in December 2023 2022 City of Houston Data Profiles
American Community Survey 2022 5-year estimates, Released in December 2023 2022 City of Houston Subject Tables
American Community Survey 2022 5-year estimates, Released in December 2023
- Population by Age and Gender
- Education Attainment
- Employment Status
- Employment by Occupation
- Employment by Industry
- Housing Occupancy Characteristics
- Marital Status
- Poverty Status of Population
- Poverty Status of Families
- Means of Transportation to Work
- Language Spoken at Home by Language Group
- Disability Characteristics
- Veteran Status
- Computers and Internet Subscriptions
American Community Survey 2022 5-year estimates, Released in December 2023
Council District Jurisdiction Tables
Council District Maps
- District A
- District B
- District C
- District D
- District E
- District F
- District G
- District H
- District I
- District J
- District K
- All Council Districts
Council District Data Profiles (2022 Demographics) Released in December 2023
- District A
- District B
- District C
- District D
- District E
- District F
- District G
- District H
- District I
- District J
- District K
Council District Demographic Subject Tables (2022 Demographics) Released in December 2023
- Population Density, Age and Gender
- Race Ethnicity
- Housing Occupancy Status
- Housing Tenure
- Household Income Range
- Housing Value
- Education Attainment
- Median Household Income
- Median Housing Value
- Median Age by Gender
- Median Gross Rent
- Gross Rent
- Poverty Status
- Marital Status
- Employment Status
- Household Type
- Units in Structure
- Means of Transportation to Work
- Language Spoken at Home
- Class of Worker
- Industry
- Occupation
- Types of Computers in Households
- Presence and Types of Internet Subscriptions in Households
- Health Insurance Coverage
- Disability Status
- Year Structure Built
- Place of Birth By Nativity and Citizenship Status
- Tenure by Units in Structure
- Bedrooms
- Workers by Vehicles Available
- Households by Vehicles Available
- Travel Time to Work
- Average Household Size By Tenure
Single Family permits 2014-2023:
Note, all of these files are Excel.
Multi-family permits 2014-2023:
Note, all of these files are Excel.
Demolition permits 2014-2023:
Note, all of these files are Excel.
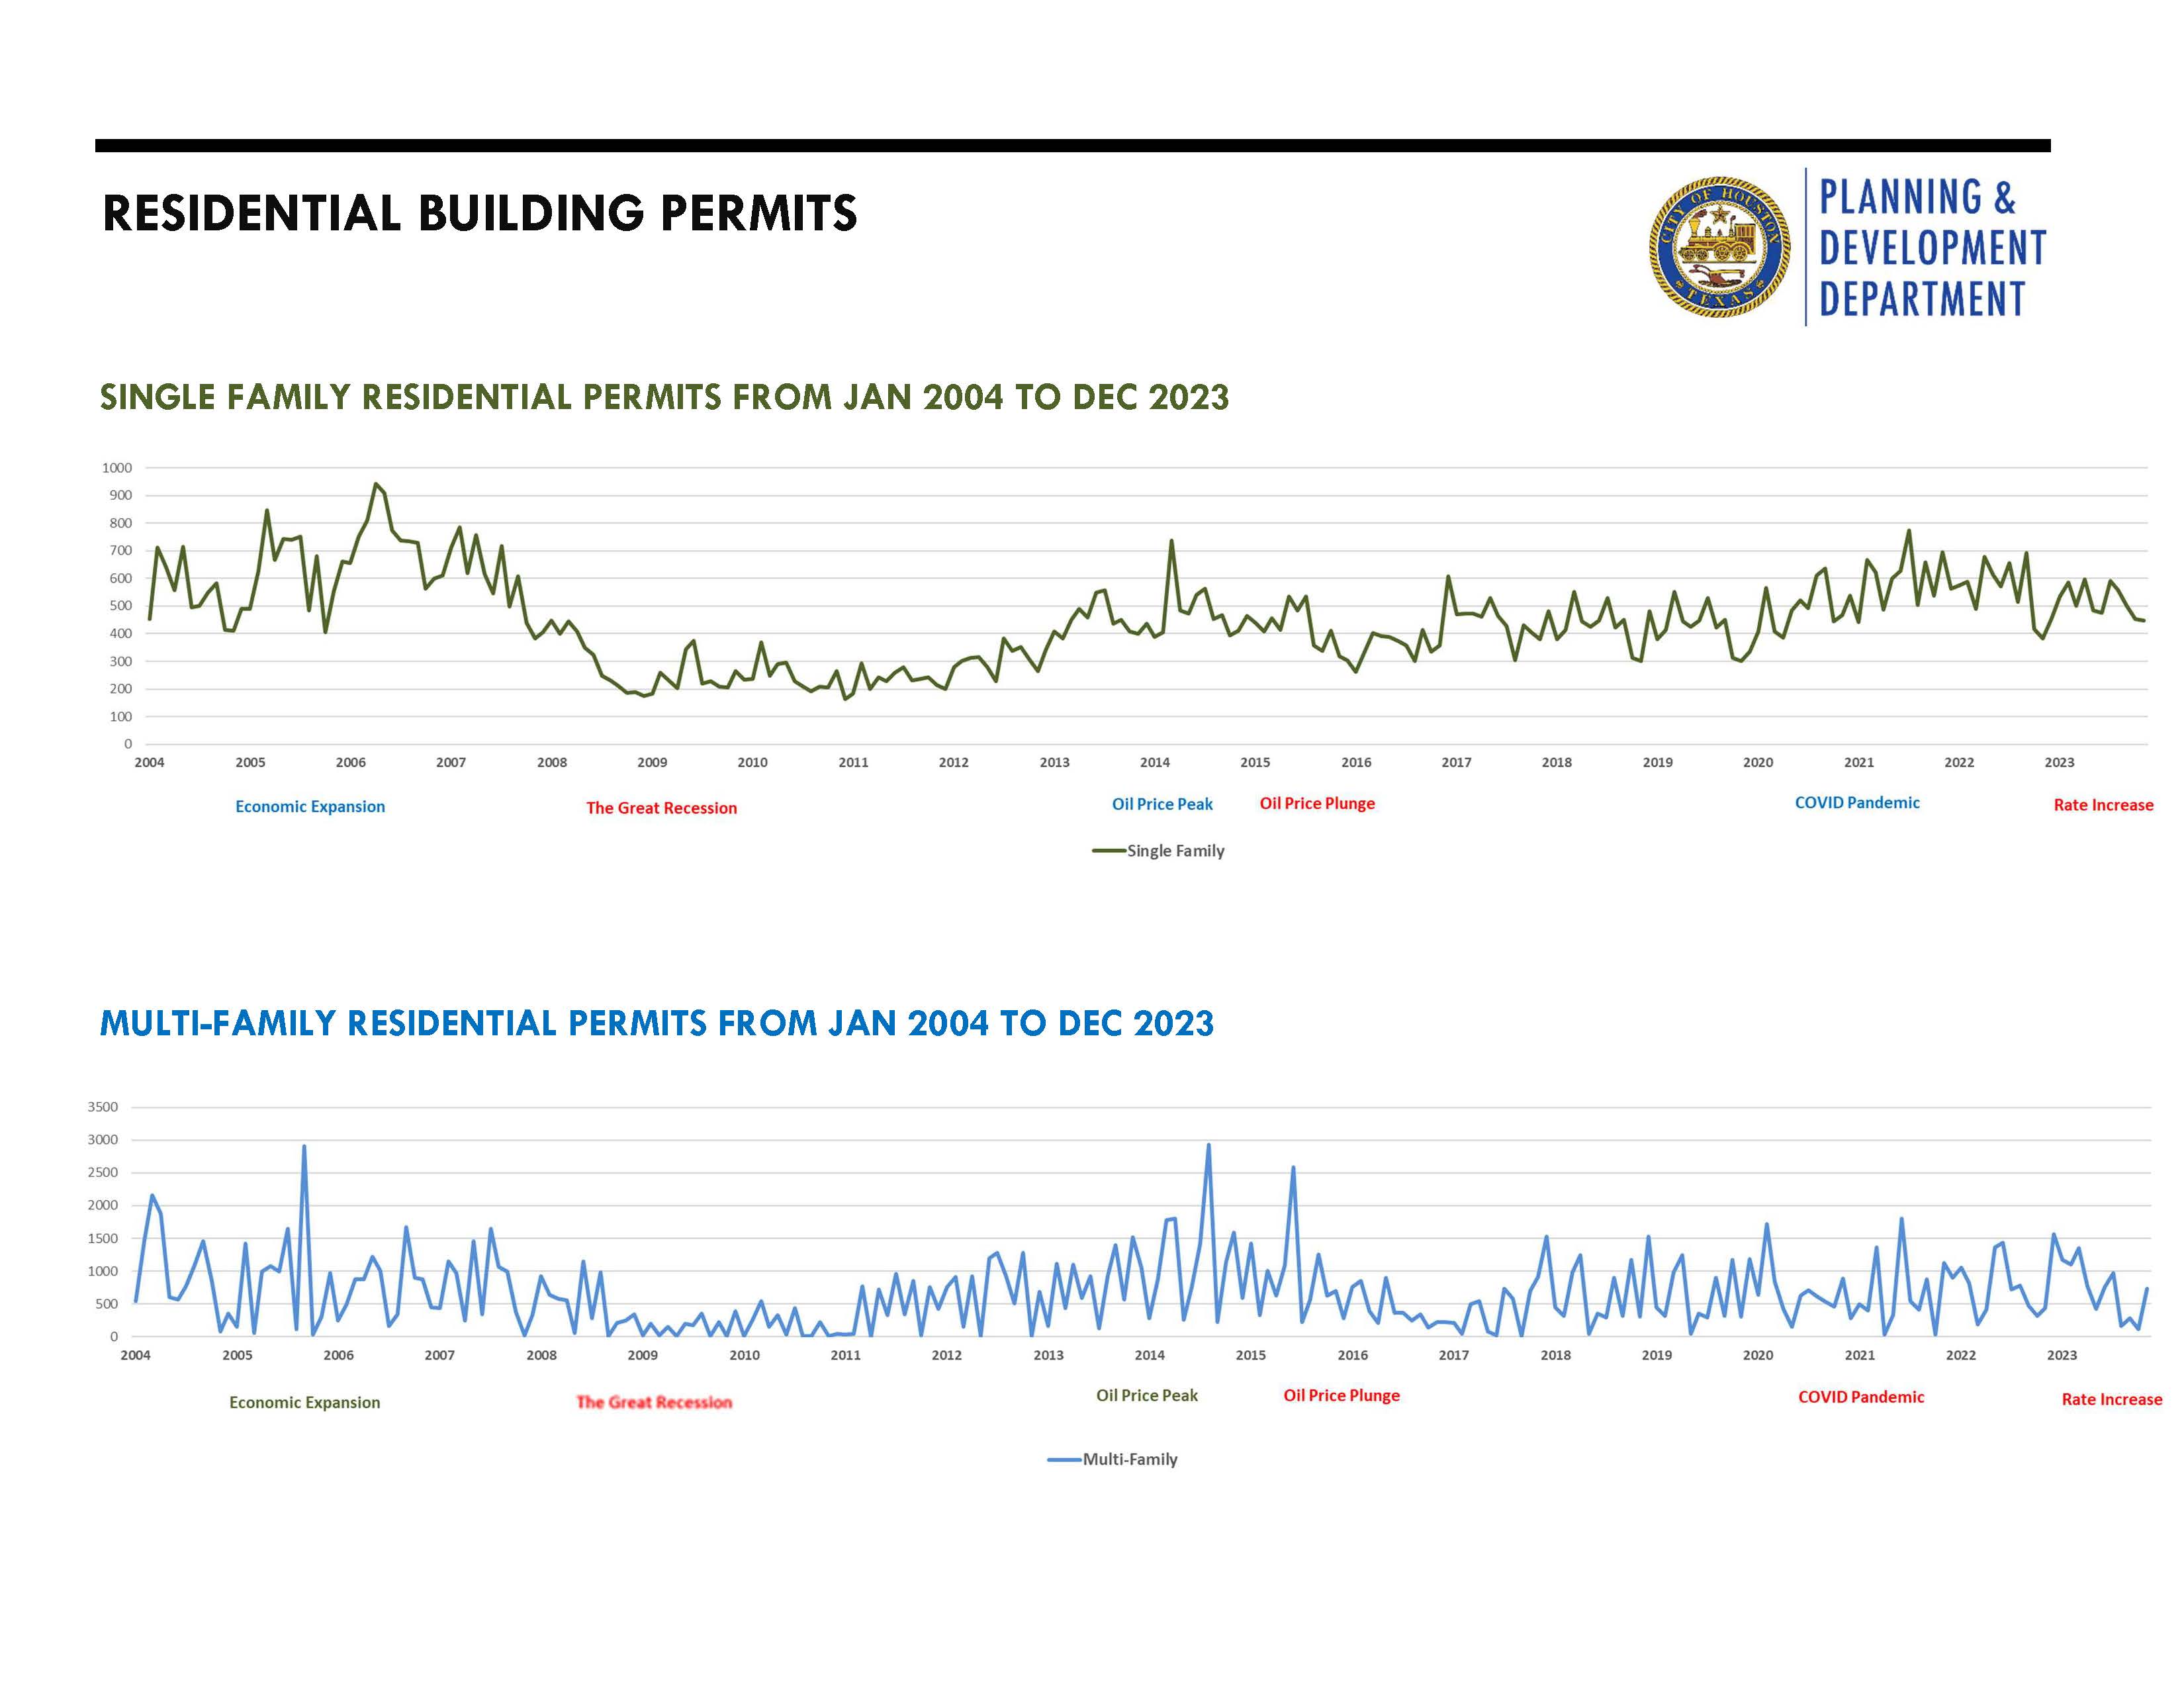
Residential Permits Jan. 2004 - Dec. 2023
Click graphic below for a .pdf
Contact Us
611 Walker Street, 6th Floor
Houston, TX 77002
Phone: 832.393.6600
planningdepartment@houstontx.gov
Stay Connected

