BARC ANIMAL SHELTER AND ADOPTIONS
As the municipal animal shelter in the fourth largest City in the United Sates, BARC has numerous initiatives occurring simultaneously: Animal Control, pet licensing, outreach, education, spay/neuter, and many, many more. So, we designed a monthly one-page summary with statistics of all of our initiatives in each area of the organization. We will publish a new document at the beginning of each month.
- Fiscal Year 2024-2025
- June 2025
- May 2025
- April 2025
- March 2025
- February 2025
- January 2025
- Calendar Year 2024
- December 2024
- November 2024
- October 2024
- September 2024
- August 2024
- July 2024
- Fiscal Year 2023-2024
- June 2024
- May 2024
- April 2024
- FY Quarter 3
- March 2024
- February 2024
- January 2024
- Calendar Year 2023
- December 2023
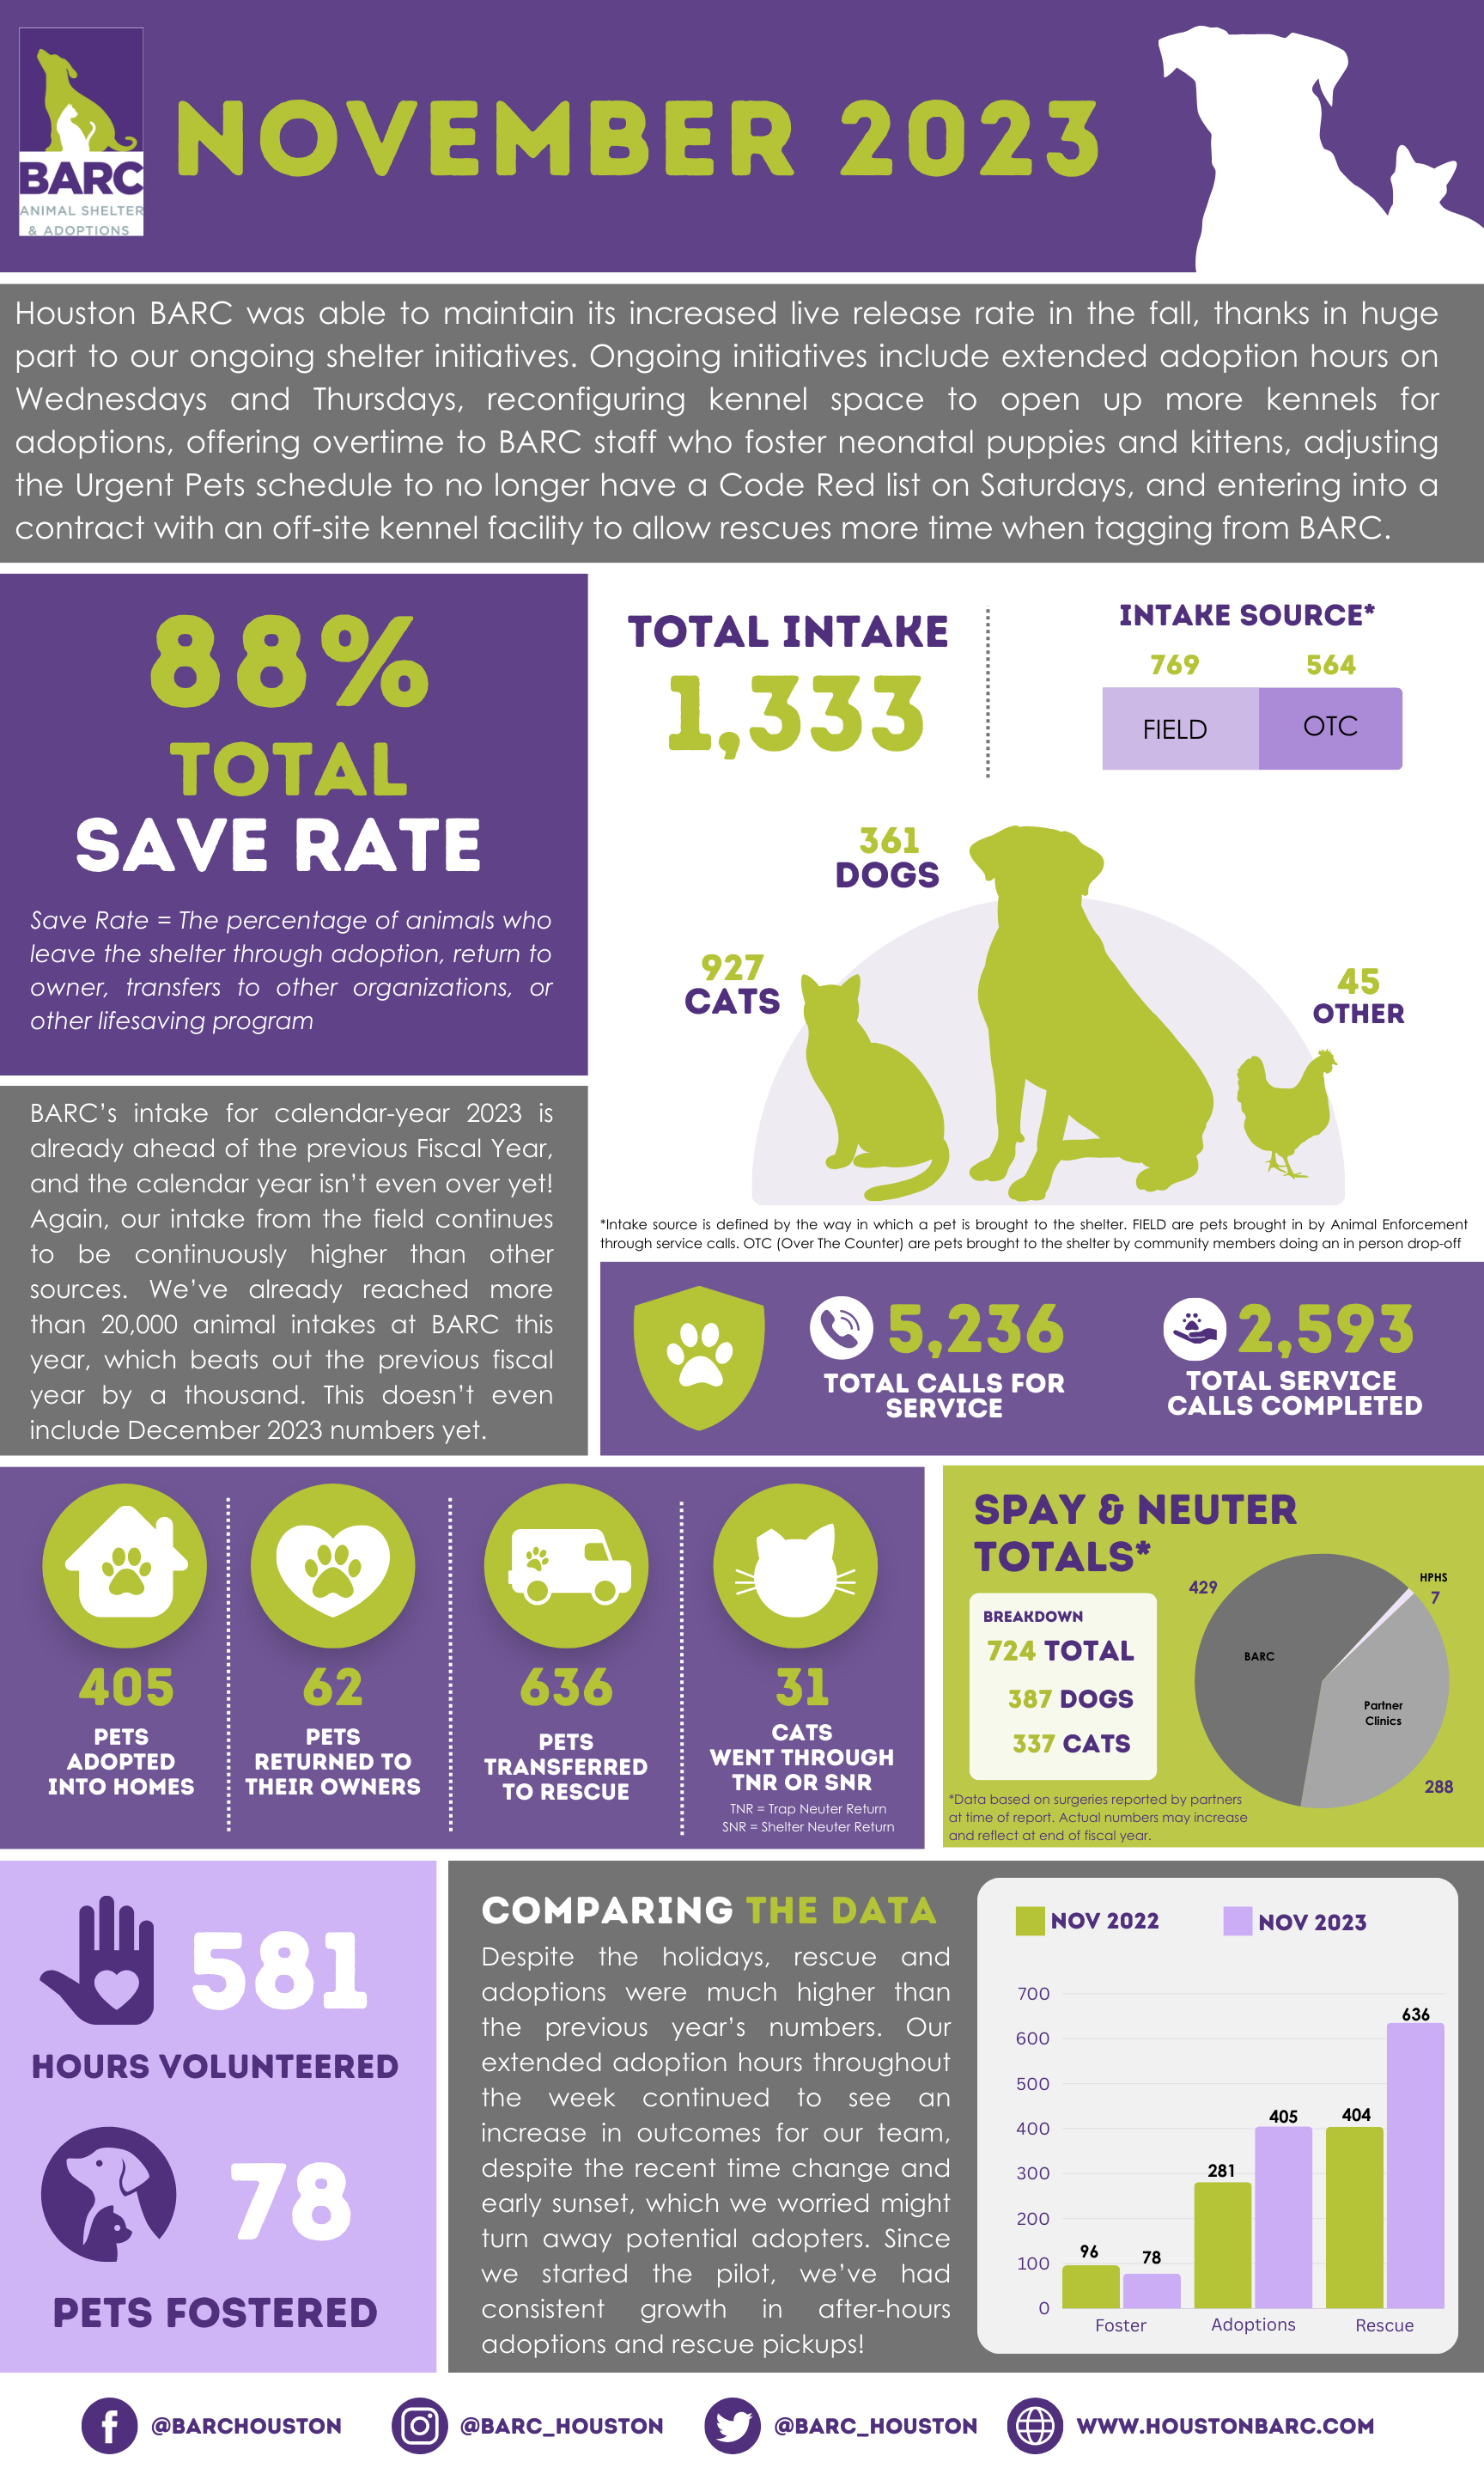
- November 2023
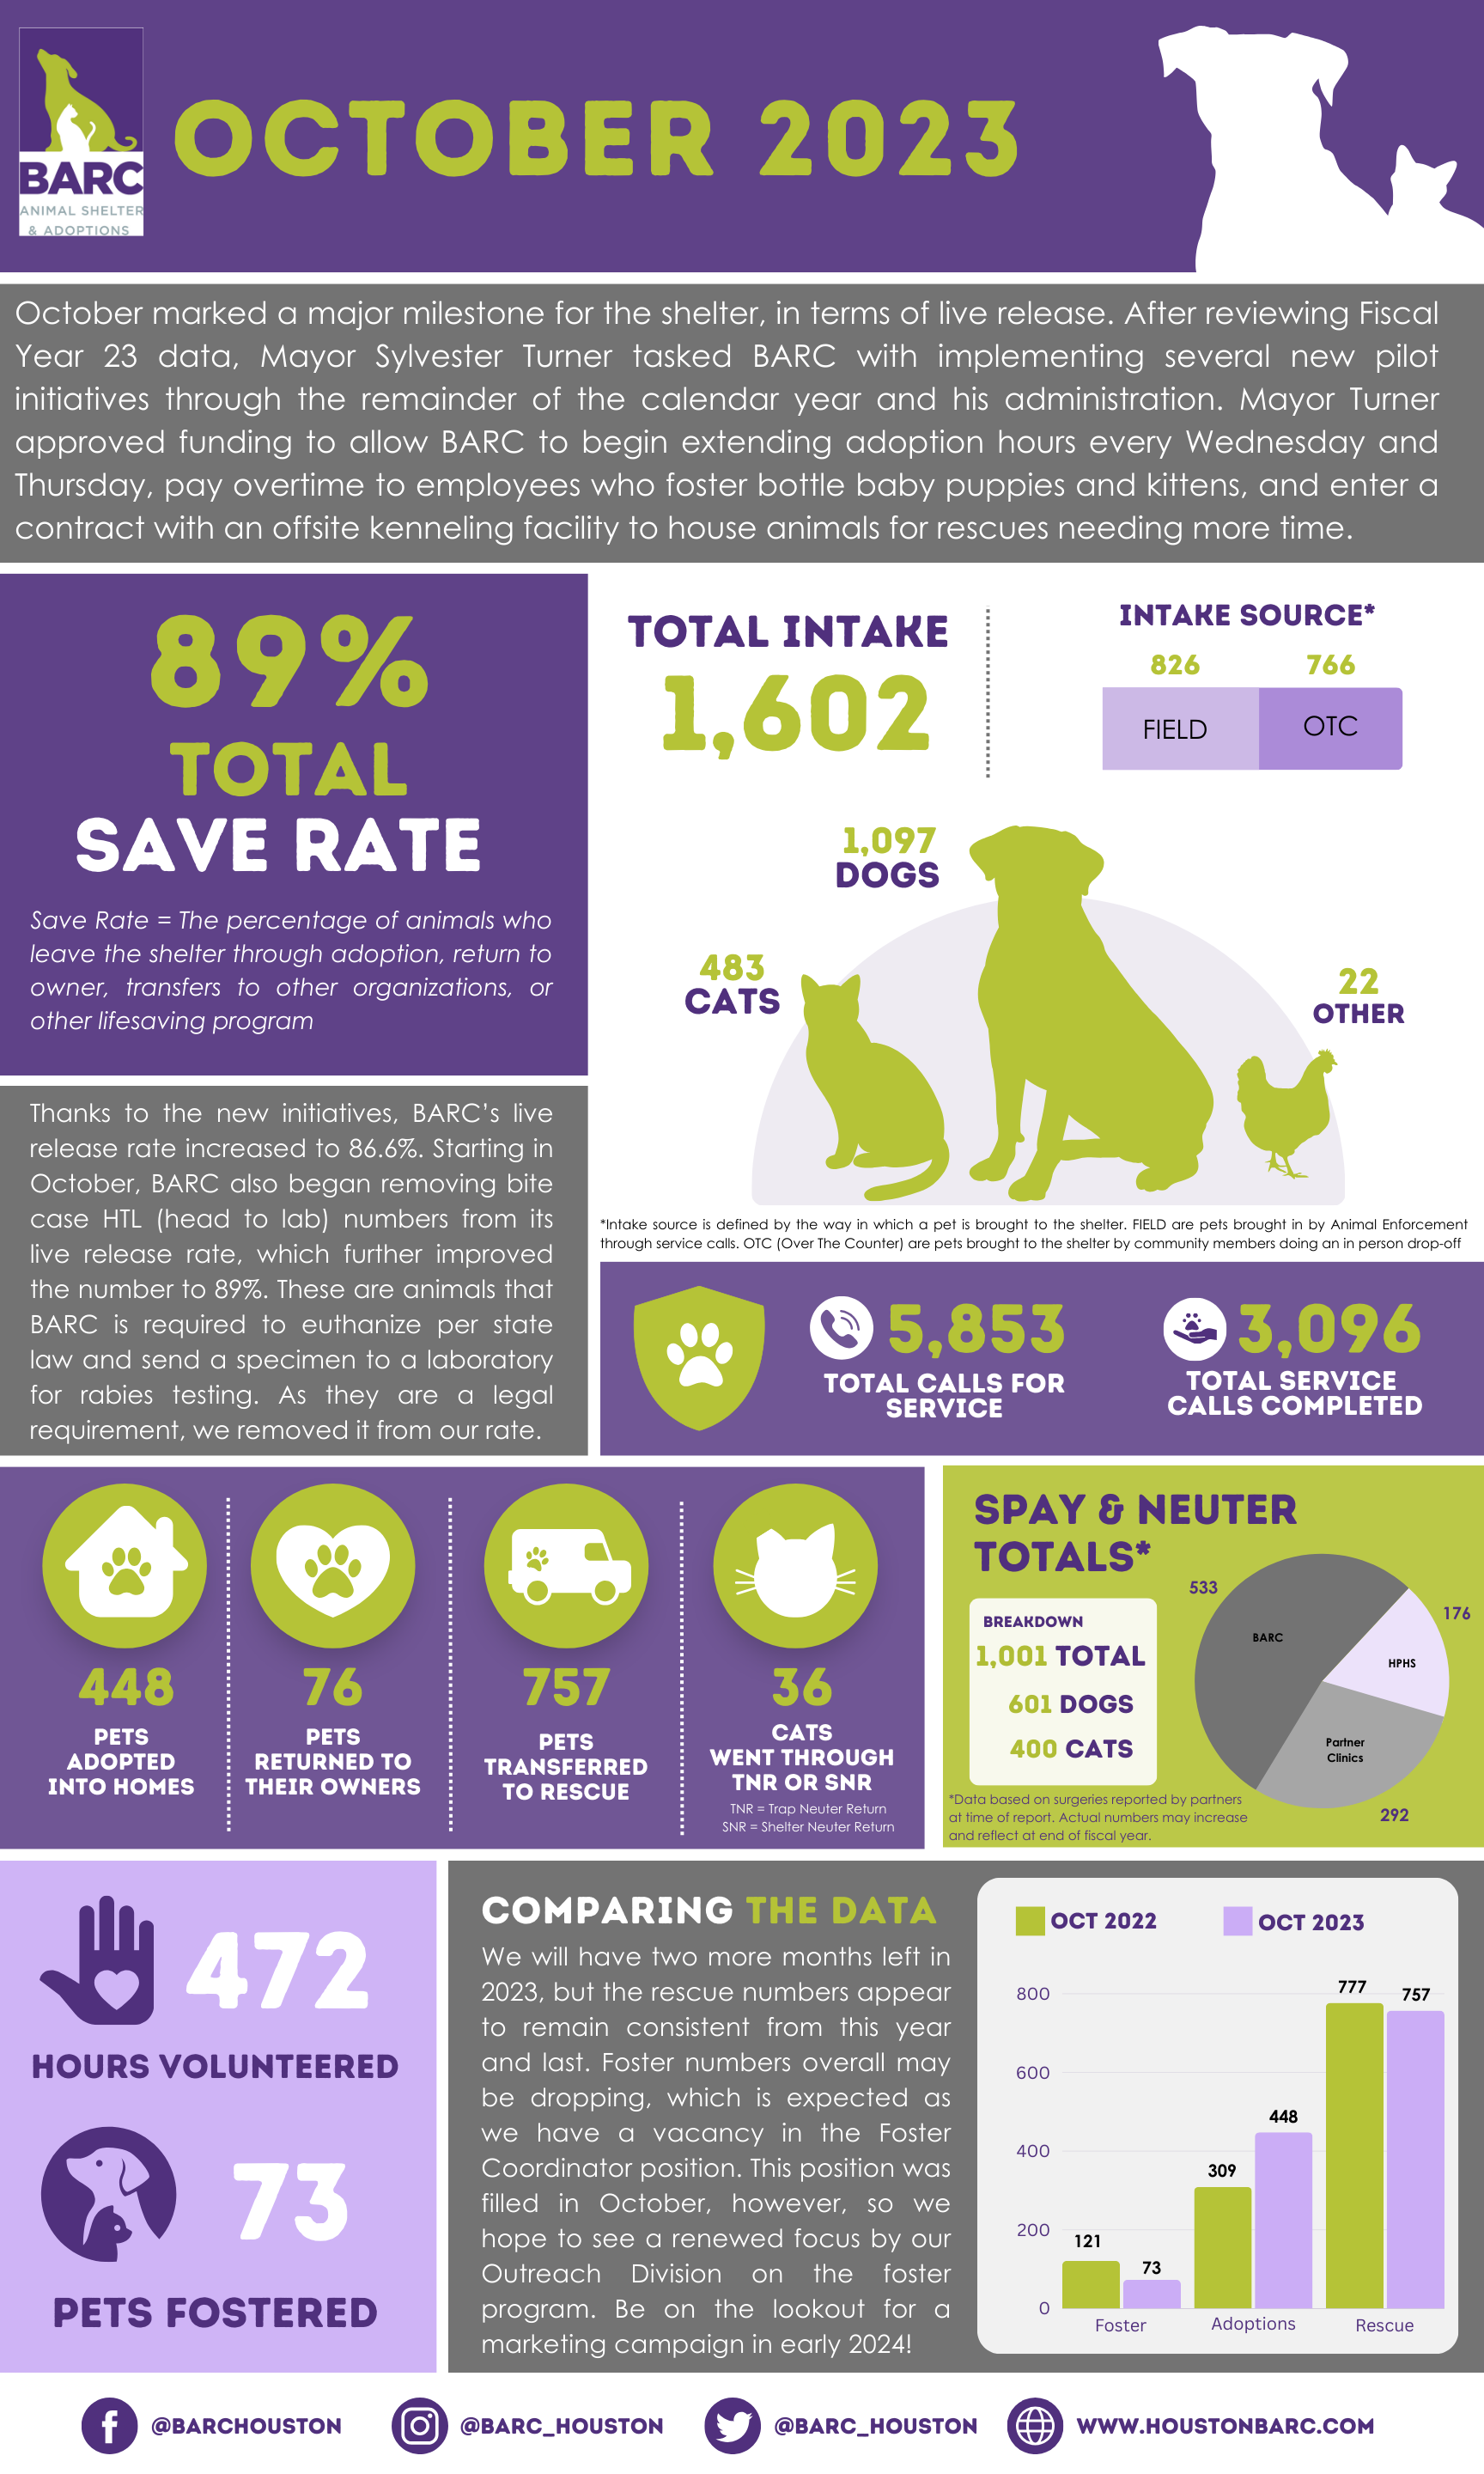
- October 2023
- September 2023
- August 2023
- July 2023
- Fiscal Year 2023
- June 2023
- May 2023
- April 2023
- March 2023
- February 2023
- January 2023
- At A Glance CY 22
- December 2022
- November 2022
- October 2022
- September 2022
- August 2022
- July 2022
- Fiscal Year 2022
- June 2022
- May 2022
- April 2022
- March 2022
- February 2022
- January 2022
- Calendar Year 2021
- December 2021
- November 2021
- October 2021
- September 2021
- August 2021
- July 2021
- Fiscal Year 2021
- June 2021
- May 2021
- April 2021
- March 2021
- February 2021
- January 2021
- Calendar Year 2020
- December 2020
- November 2020
- October 2020
- September 2020
- August 2020
- July 2020
- FY 2020 Results
- June 2020
- May 2020
- April 2020
- March 2020
- February 2020
- January 2020
At-A-Glance Statistics prior to 2020 are listed in the Archive section below
Archive Statistics and Reports
The Save Rate looks at how many animals were saved based upon the intake of animals. Unlike the Live Release Rate, it does not allow for the exclusion of any outcomes so and it does count animals that were currently in custody. It simply shows the percentage of the animals taken in that were NOT euthanized.
The Save Rate formula = (Live Intakes - Other Outcome)/Live Intakes
Please note:
Other Intakes = Impounds for cruelty cases and protective custody and pets born while in care.
Other Live Outcomes = Barn Cat and TNR/ RTF programs
- August 2024
- July 2024
- Fiscal Year 2023-2024
- June 2024
- May 2024
- April 2024
- FY Quarter 3
- March 2024
- February 2024
- January 2024
- December 2023
- November 2023
- October 2023
- September 2023
- August 2023
- July 2023
- June 2023
- May 2023
- April 2023
- March 2023
- February 2023
- January 2023
- Calendar Year 2022
- December 2022
- November 2022
- October 2022
- September 2022
- August 2022
- July 2022
- Fiscal Year 2022
- June 2022
- May 2022
- April 2022
- March 2022
- February 2022
- January 2022
- Calendar Year 2021
- December 2021
- November 2021
- October 2021
- September 2021
- August 2021
- July 2021
- Fiscal Year 2021
- June 2021
- Save Rate May 2021
- Save Rate April 2021
- Save Rate March 2021
- Save Rate February 2021
- Save Rate January 2021
The Asilomar Accords uses a set of criteria, definitions, a statistics table for tracking shelter populations. The Asilomar Accords Live Release Rate formula is used for determining live release rates in shelters. As the name states, the formula only accounts for animals positively outcome by the shelter – with the exception of animals that either go missing or died while in custody, or are given euthanasia at the request of a relinquishing owner where the animal has been classified as “unhealthy” and “untreatable.” The LRR formula also takes into account the starting animal inventory for the reporting period as some of the animals outcomed may have been taken in prior to the start of the reporting period.
To understand more about the definitions, terminologies and criteria in the Asilomar Accords, go to www.shelteranimalscount.org/
Live Release Rate Formula = Total Live Animal Outcomes / (All Outcomes - Unhealthy/Untreatable Owner Requested Euthanasia)- Calendar Year 2022
- Fiscal Year 2022
- Calendar Year 2021
- Fiscal Year 2021
- Calendar Year 2020
- Fiscal Year 2020
- Calendar Year 2019
- Fiscal Year 2019
- Calendar Year 2018
- Fiscal Year 2018
- Calendar Year 2017
- Fiscal Year 2017
- 90-for-90
- Calendar Year 2016
- Fiscal Year 2016
- Calendar Year 2015
- 2012 Archive
- 2011 Archive
- 2010 Archive (September to December)
BARC Information
Houston, TX 77026
Call 3-1-1 for more information
Get Involved


